Problem Set 9: Radiation Exposure
Web-CAT: Submit Python programs to this automated grading platform.
Task Outline
- Due Date: Monday, November 18, 2019
- Total Points: 10
- Implement a
Pythonprogram that determines the amount of radiation a person is exposed to, in a given period of time.
Background Theory
- Radioactive decay is the process by which an unstable atom loses energy and emits ionizing particles, in what is commonly referred to as radiation. Exposure to radiation can be dangerous, and is very important to measure, to ensure that a person is not exposed to a large amount of it.
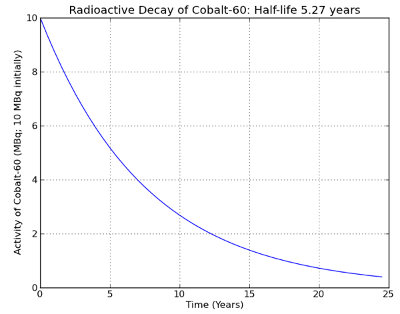
- The radioactivity of a material decreases over time, as the material decays. A radioactive decay curve describes this decay. The x-axis measures time, and the y-axis measures the amount of activity produced by the radioactive sample.
- Activity is defined as the rate at which the nuclei within the sample undergo transitions. Put simply, this measures how much radiation is emitted at any one point in time.
- The measurement of activity is called the Becquerel(Bq). The following diagram is a sample of a radioactive decay curve.
The Problem Scope
- Here's the problem we'd like to solve. Let's say that Sarina has moved into a new apartment. Unknown to her, there is a sample of Cobalt-60 inside one of the walls of the apartment. Initially, that sample had 10MBq of activity, but she moves in after the sample had been there for 5 years. She lives in the apartment for 6 years, then leaves. How much radiation was she exposed to?
- We can actually figure this out using the radioactive decay curve from above. What we want to know is her total radiation exposure from year 5 to year 11.
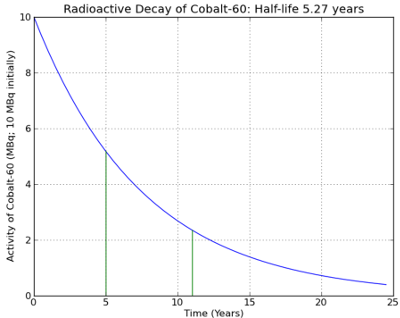
- Total radiaton exposure corresponds to the area between the two green lines at time = 5 and time = 11, and under the blue radioactive decay curve. This should make intuitive sense, if the x axis measures time, and the y axis measures activity, then the area under the curve measures (time * activity), or (years * MBq), which is approximately the total number of MBq that Sarnia was exposed to during her time in the apartment.
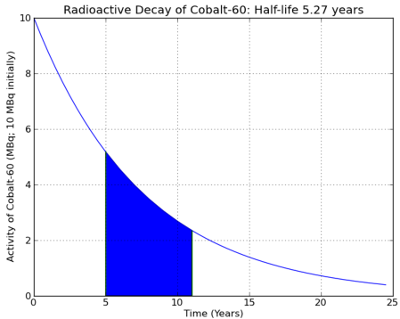
- Now, how do we calculate this area? Unlike a simple shape, like a square, or a circle, we have no easy way to determine what the area under this curve is.
- However, there is a technique that can provide us with some assistance, namely, approximation. Let's use an approximation algorithm to estimate the area under the curve. We can do so by first splitting up the area into equally-sized rectangles. In this case, there are six of them, corresponding to one rectangle per year:
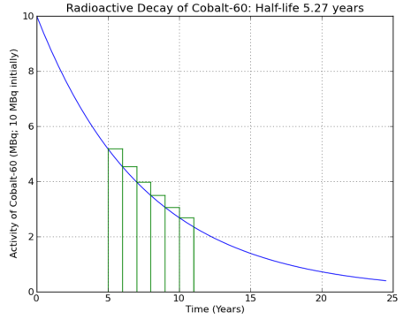
- Once we've done that, we can figure out the area of each rectangle pretty easily. Recall that the area of a rectangle is determined by multiplying the height of a rectangle by its width. The height of this rectangle is the value of the curve at
5.0. If the curve is described by a function,f(x), then we can obtain the value of the curve by calculatingf(5.0).
f(5.0) = 5.181
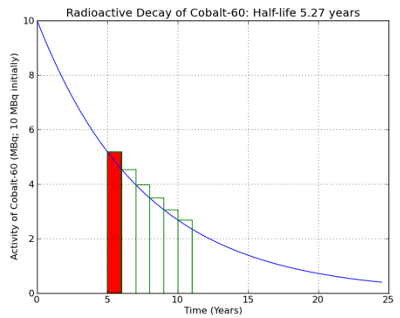
- The width of this rectangle is
1.0. So, the area of this single rectangle is:1.0 * 5.181 = 5.181. To approximate how much radiation Sarina was exposed to, we then calculate the area of each successive rectangle, and then sum up the areas of each rectangle to get the total. When we do this, we find that Sarina was exposed to22.94241041057671 MBqof radiation.
Hints
- In this problem set, you are asked to find the amount of radiation that a person is exposed to, during some period of time. In order to complete this assignment, you'll need to know what the value of the radioactive decay curve is, at various points. There is a function
f(x)that has been provided for you, which mathematically describes the radioactive decay curve for this problem. - This problem set is relatively straightforward if you only consider the cases where the widths of the rectangles are integer values. Those cases can be handled with a simple
forloop. - However, if you examine the provided test bench, you should notice that some of the rectangle widths are decimal values, like
0.5. Recall that theforloop can only handle integer values for its boundaries. - Therefore, you will need to seek another approach that can handle decimal-valued rectangle widths.
- You should find out the number of rectangles that are within the defined region. How would you calculate this number? Perhaps the following equation would work:
gaps = (stop-start)/step
- Then, you should create a list which has the same size as the number of rectangles, with all of its elements initialized to
0. Recall that the multiplication operator can perform this task:
timeposts = [0] * gaps
- Next, you should loop across the
timepostslist, and fill it withtimevalues that correspond to the position of each rectangle. For the example described in the Background section, thetimepostslist would be as follows:
timeposts = [5, 6, 7, 8, 9, 10]
- Then, it is simply a matter of looping across the
timepostslist, calculating the product off(x)*step, and summing each of these products to result in the area under the curve.
Code Distribution
| Description | File Size | File Name |
|---|---|---|
Python Source Code for Radiation Exposure |
1.5KB | pset09.zip |
Contents of pset09.zip:
PSet09RadiationExposure/
├── radiationexposure.py
└── testradiationexposure.py
Specification
- Write a
Pythonprogram in the fileradiationexposure.pywhich calculates the amount of radiation exposure in a given time period. - You will write your solution in a function called
radiationexposure(start, stop, step)right below the place where it says:YOUR CODE HERE - When the function call
radiationexposure(5, 11, 1)is executed, the output of the program should be: 22.94241041057671
Testing
- Run the file
testradiationexposure.pyto execute thePyUnittest bench.PyUnitindicates a successful test with anOKoutput, and an unsuccessful test with aFAILoutput.
Submission
- Upload the file
radiationexposure.pyto the Web-CAT automated grading platform.